ARCHIVE FILE
This article was published in 1987
See the original document
Dieldrin Residues in Milk in 2 Dairy Herds in the Hunter Valley
M. EMMS, Veterinary Inspector, Singleton P.P. Board
LEAD UP EVENTS
Bulk milk sampling of Rail Tankers from the Singleton Dairy Factory in 1985, gave the following results:-
| 12th August, 1985 | 0.05 mg/kg Dieldrin |
| 23rd September, 1985 | 0.10 mg/kg Dieldrin |
| 21st October, 1985 | 0.15 mg/kg Dieldrin |
Individual sampling of tanker runs which supply the Singleton Factory were carried out on the 1st and 2nd October, 1985, by the Dairy Corporation. Following this sampling which revealed 2 tanker runs were causing the problem, the individual suppliers on these runs were sampled. This revealed the problem was originating from 2 Dairies at Mitchells Flat and the following results were obtained :
| Property 1 | 18.11.85 | 1.43 mg/kg Dieldrin |
| Property 2 | 19.11.85 | 1.39 mg/kg Dieldrin |
These results were reported to the Dairy Corporation Officer, Singleton on 29th November, 1985.
A further check sample of bulk milk from Property 1 was taken on the 1st December, 1985. Results:
| Bulk milk | 1.54 mg/kg Dieldrin |
Both suppliers were put off supply on 5th December, 1985.
The Veterinary Inspector, Singleton was first made aware of this problem late on the afternoon of the 27th November, 1985, by the District Agronomist and the Dairy Corporation Officer at Singleton. Three weeks prior to this the Veterinary Inspector had heard via the Saleyards that there was a problem with Dieldrin in Singleton milk.
On the 28th November, 1985, the D.V.S., S. King of Newcastle notified me officially of the Dieldrin Residues in the milk of 2 suppliers to the Singleton Factory.
ACTION TAKEN AFTER OFFICIAL NOTIFICATION
A voluntary detention of stock was undertaken on both properties till confirmation of results was received from the Dairy Corporation. Confirmation of Dieldrin Residues in bulk milk was received by the D.V.S. Newcastle on 4th December, 1985, and Form 2 Detention Notices - Section 8 were issued on both properties on 5th December, 1985.
On 1st December, 1985, the Dairy Corporation Officer and the District Agronomist, Singleton collected milk, soil, and feed samples from property 1. The results of this sampling are set out below:-
| INDIVIDUAL MILK SAMPLES | |||
|---|---|---|---|
| COW NO. | DAYS LACTATION | CALVING DATE | mg/kg DIELDRIN |
| 310 | 325 | 23/12/84 | 1.35 |
| 317 | 325 | 23/12/84 | 0.83 |
| 271 | 52 | 11/10/85 | 1.76 |
| 330 | 189 | 28/5/85 | 1.55 |
| 312 | 218 | 28/4/05 | 1.67 |
| 336 | 72 | 20/9/85 | 1.61 |
| 22 | 13 | 18/11/85 | 1.29 |
| 373 | 117 | 6/8/85 | 1.97 |
| 52 | 167 | 18/6/85 | 0.61 |
| N = 9, Mean = 1.40 mg/kg Dieldrin Standard Deviation - 0.44 | |||
| SAMPLE | mg/kg DIELDRIN |
|---|---|
| Bulk Milk | 1.54 |
| Bran from 3 bags | 0.40 |
| Barley - Top of silo and auger | 0.01 |
| Attunga lime | 0.01 |
| Barley - Bottom of silo old stock | 0.01 |
| Bran and Barley Mix | 0.42 |
A further lot of samples were collected from Property 2 on 1st and 3rd December, 1985, and these gave the following results:-
| INDIVIDUAL MILK SAMPLES | ||
|---|---|---|
| COW NO. | CALVING DATE | mg/kg DIELDRIN |
| 440 | 15/8/85 | 1.04 |
| 407 | 28/6/85 | 1.38 |
| 484 | 8/10/85 | 1.22 |
| 372 | 10/10/85 | 1.24 |
| 382 | 15/1/85 | 1.57 |
| 393 | 14/8/85 | 1.18 |
| 297 | 10/2/85 | 1.48 |
| N = 7, Mean = 1.30 mg/kg Dieldrin, Standard Deviation = 0.18 | ||
| SAMPLE | mg/kg DIELDRIN |
|---|---|
| Bulk Milk | 1.31 |
| Bran from 3 bags | 0.25 |
| Barley from auger and silo | 0.01 |
| Mixture Bran and Barley from bails | 0.07 |
| Mixture Barley and Sorghun mix from bottom of silo | 0.01 |
| Mixture from floor of shed | 0.13 |
These results indicated that the Bran was the source of Dieldrin contamination.
BRAN
Both owners were mixing 8 bags of Bran to a mix-all load (approx. 1.5 tonne) of feed. The owners had originally been buying their Bran locally but in May, 1985, due to lower costs, commenced buying truck loads from a miller at Dubbo.
These truck loads were shared proportionately between the 2 owners. A mixture of loads existed in the shed where the Bran was stored as older stocks were not brought forward as each new lot was received.
The table below gives the results of 15 bags sampled from the 360 in the shed.
| SAMPLE NO. | BAG NO. | mg/kg DIELDRIN |
|---|---|---|
| 1 | 06448 | 0.20 |
| 2 | 0003573 | 0.12 |
| 3 | 06386 | 5.0 |
| 4 | 04417 | 0.02 |
| 5 | 05135 | 0.38 |
| 6 | 09721 | 0.49 |
| 7 | 08702 | 0.25 |
| 8 | 02766 | 0.14 |
| 9 | 0000084 | 0.34 |
| 10 | 0001016 | 0.17 |
| 11 | 0000602 | 0.53 |
| 12 | 03713 | 0.44 |
| 13 | 0000558 | 0.44 |
| 14 | 07255 | 0.05 |
| 15 | 0004523 | 0.32 |
| N = 15 , Mean = 0.59 mg/kg Dieldrin, Standard Deviation = 1.23 | ||
The results showed that there were considerable amounts of Dieldrin in the bags sampled which came from various parts of the stack.
The Bran from this source was fed to both herds from early in June, 1985.
CASE 1.
Property 1.
FARM ENTERPRISE.
This is a dairy farm at Mitchells Flat utilising irrigated creek flats and some elevated poorer country running onto the flats. This farm normally milks between 45 and 50 cows with a daily milk production of 220 plus gallons.
The cows are all Friesian in this herd. The cows are fed crushed grain in the bails at each milking according to production levels - approx. 8 - 12 lb per day.
The management on this farm is extremely good as are also the dairy, sheds, fences etc.
ELECTED COURSE OF ACTION
When this farmer was put off supply on 5th December, 1985, he elected on the following course of action.
(i) Dried off any cows which had been milking for 8 or more months.
(ii) Left calves on any cows calving after this date.
(iii) Cut out feeding grain in bails so the herd was only pasture fed.
(iv) Continued milking twice daily for 3 weeks then changed to 3 milkings in 48 hours for 1 month then turned to once a day milking.
(v) All calves on the bucket were fed on large quantities of milk. One group of 11 older calves were given 60 gallons per day.
RESULTS OF BULK MILK SAMPLING
The Dairy Corporation continued to test samples of bulk milk from this property on a regular basis to start with but decreased the amount of testing as time went on. As the amount of testing by the Dairy Corporation decreased and the delay in receiving results from the Dairy Corporation increased, some sampling of bulk milk was carried out in conjunction with the individual cow sampling being carried out by the Veterinary Inspector at Singleton. There was some discrepancy between the results obtained from the Board of Tick Control Laboratory and those received from the Dairy Corporation Laboratory.
The graph following shows the reduction in Dieldrin concentrations in bulk milk over the period of time from 18th November, 1985, to this farmer surrendering his quota and ceasing the supply of milk to the Dairy Corporation in April, 1986.
Figure 1.
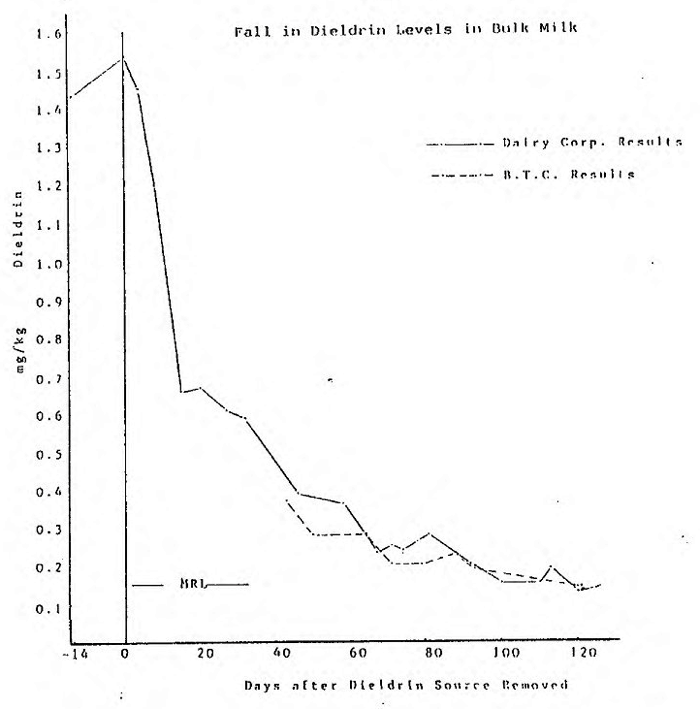
From the above graph it is considered that the loss of Dieldrin from the bulk milk occurs in 3 Stages as set out below:-
| STAGE 1 | STAGE 2 | STAGE 3 | |||
|---|---|---|---|---|---|
| DAYS | RATE | DAYS | RATE | DAYS | RATE |
| 0 - 15 | 0.059 | 15 - 46 | 0.0087 | 46 - 99 | 0.0045 |
The above figures are based on results received from the Dairy Corporation. The Dairy Corporation results differ somewhat from those results received from the Board of Tick Control Laboratory between 13.1.86 and 1.4.86. These are also plotted on the Graph.
With these results several factors of management should be
kept in mind.
1. In the first week the owner was off supply, 8 cows in late lactation were dried off.
2. All cows that calved after the 1st December, 1985, had the calves left on them and were not milked into the vat.
3. As Dieldrin contaminated feed had been fed in this herd for 5 months it can be assumed that there would be little difference in Dieldrin concentrations in early or late lactating animals. Further cows were dried off at a later date as they reached the end of their lactation.
As there were no fresh cows being milked into the vat, the concentration of Dieldrin Residue in the vat gave an indication of the Dieldrin flowing from the affected cows.
CASE 2.
Property 2.
FRAM ENTERPRISE
This is a dairy farm at Michells Flat adjoining Property 1. This property is basically irrigated creek flats. The herd on this farm is an Ayrshire herd milking approx. 90 cows per day with a daily milk production of 240 plus gallons per day.
The cows are fed grain in the bails ad lib. at each milking. The Management on this farm is only average as are the dairy, yards etc.
ELECTED COURSE OF ACTION
The farmer was put off supply on 5th December, 1985, and he elected the following course of action:-
(i) Continued to milk all cows twice daily.
(ii) Cows calving after this date had the calves left on them.
(iii) Continued to feed ad lib. amounts of grain in the bails.
(iv) Feed all calves on the bucket large amounts of milk.
(v) Feed copious quantities of milk to pigs.
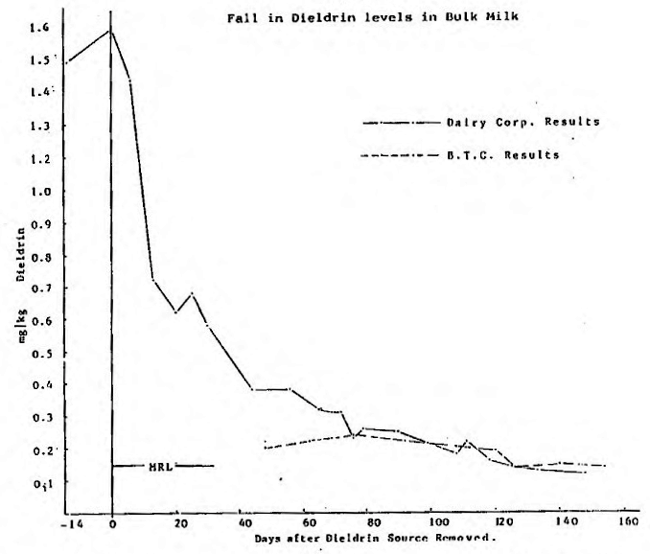
RESULTS OF BULK MILK SAMPLING
The graph following shows the reduction in Dieldrin concentrations in bulk milk over the period of time from 19th November, 1985, to 29th April, 1985, when the concentration of Dieldrin had fallen to 0.12 mg/kg. After this point the concentrations of Dieldrin dropped gradually in a linear fashion to 0.04 mg/kg over a period of 6 months (approx.).
Figure 3.
With these results several management factors should be kept in mind.
1. All cows that calved after ist December, 1985., had the calves left on them and were not milked into the vat.
2. All cows were kept milking as long as possible hoping they would excrete the Dieldrin at a faster rate than if dried off.
3. The Dieldrin contaminated feed was fed to both lactating and dry cows for a period of 5 months.
4. This owner continued to feed and milk as usual and maintained good body condition on each animal.
As there were no fresh cows being milked into the vat, the concentration of Dieldrin residue in the vat gave an indication of the Dieldrin flowing from affected cows.
ECONOMIC EFFECT ON OWNERS
Both of the owners concerned were in a sound financial position at the 10.12.85. One farm was owned outright and held sufficient monies on hand to meet commitments plus have money invested for emergencies. The second owner was in the process of making his last farm payment in December, 1985, and had sufficient funds to meet commitments and emergencies in the bank.
Both owners taxable incomes for the 84/85 Financial Year were in the range of $40,000.
Basically both properties were sound financial propositions which were doing well.
At the commencement of problems on 1.12.85, both farmers were advised of what may take place in the future as regards getting back on supply and what period of time this may take.
They were advised to look at the economics of all moves they made. Both owners elected to accept the interest free advances offered by the Dairy Corporation. Each owner opted for different strategies:-
Case 1.-Property 1.
The owner opted to cut costs as much as possible and reduce the money going out each month.
The owner reassessed his situation in February, 1986, and decided that the only way he could keep going was to surrender his quota or he would have to borrow money and go into debt. This he did in April, 1986, with the surrender value of the quota being approx. $52,000. This repaid his interest free advance from the Dairy Corporation and other debts incurred after 1.12.86. The owner then found off farm employment which gave him an income which was supplemented by money made from the sale of cattle as he changed to a small vealer raising situation.
Since April, 1986, the owner has been faced with large expenses associated with legal action being taken against the Millers at Dubbo and is having difficulty making ends meet. He has a claim for $60,000 approx. lodged against the Miller at Dubbo but legal advice at present is that it may be 3 years hence before he gets anything out of this.
The whole affair has been financially disastrous for this owner who was regarded as being one of the best top Dairy Operators in the area from all points of view.
CASE 2. -PROPERTY 2.
The owner continued to carry on as he normally would have and hope to meet all on-going costs. The owner continued to operate buying in grain and hay as he normally would have.
This owner was eventually forced to go to the bank and borrow a further $30,000 at the present high interest rates to carry on after he had depleted his reserves.
This owner has a claim for $100,000 approx. against the Millers at Dubbo being prepared but again his solicitors have advised that it will be several years before he is likely to get any of this money.
This owner has gone from a sound financial position to one of economic disaster with no relief coming in the short term.
The claims for $60,000 and $100,000 in these 2 Cases only relate to loss of income and expenses already incurred and do not take into account legal fees etc., so there will be no financial gains in these figures for the owners.
With the long period of Detention under a Form 2 on both farms (approx. 11 months) the owners were unable to sell stock as they would have under normal conditions which increased their number of stock and the amount of feed they required for these animals. This pushed their feeding costs up and this was further compounded by Drought conditions which occurred through autumn, winter and early spring of 1986.
In this case we have had an economically disastrous position arise with these 2 owners through no fault of their own.
DISCUSSION
On examining the graphs showing the fall in Dieldrin concentrations in bulk milk from these properties (Figure 1 & 3) it can be seen that the concentrations of Dieldrin fell at the same rate in both cases.
When the Dieldrin Source was withdrawn on 1.12.85, the concentrations of Dieldrin fell very rapidly in the first 14 and 16 days respectively with the mean rate of decline being 0.58 mg/kg/day of Dieldrin. During this period the concentration halved in about 12 days.
After this period the Dieldrin concentrations dropped at a much lower rate during the next 31 days with the rate being 0.01 mg/kg/ day of Dieldrin. During this period the concentration halved in about 35 days.
After this point the fall in Dieldrin concentrations reduced markedly and in the next 53 days fell by 0.0037 mg/kg/day of Dieldrin.
During this period the concentration halved in about 53 days. This may be seen on the accompanying graph (Figure 5) which approximates the observed decline in Dieldrin concentration.
Figure 5.
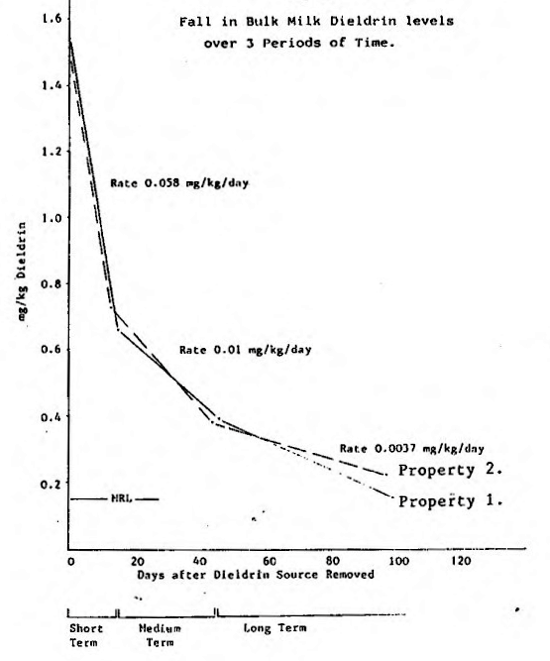
When considering reasons for the decline in Dieldrin concentrations, it can be hypothesised that there are 3 types of sources which would affect the Dieldrin concentrations seen in the bulk milk. These are:-
| Short Term Sources | Medium Term Sources | Long Term Sources |
|---|---|---|
| Feed Ruminal Contents Blood |
Muscle Liver Bone Marrow Nervous System |
Body Fat |
It may be. suggested that these 3 sources relate to the periods of decline of Dieldrin concentrations seen in bulk milk in this case. The short term sources are those which would disappear very rapidly once the intake of Dieldrin ceased and would explain the initial sudden drop.
The Dieldrin held in the medium term sources would move out at a slower rate with the long term deposits of body fat following these.
With the 2 herds involved there is virtually no difference in the rate at which the Dieldrin concentrations in bulk milk declined. We had 2 contrasting feeding and management systems where one owner continued production feeding and milking practices and the other stopped feeding and regular milking. Feeding and milking practices were not related to the decline in Dieldrin concentrations in bulk milk on these 2 properties.
The results from these 2 properties were given to Bob Murison, Biometrician at Tamworth for further examination.
A non-linear regression analysis has been done using the formula.
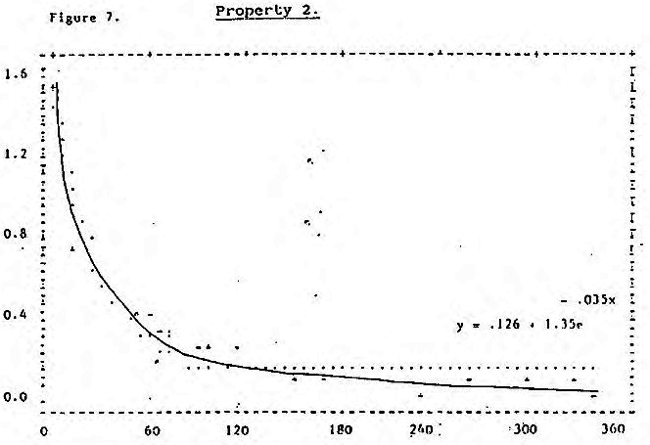
y = A + BeСх
The results are plotted on the graphs in Figures 6 and 7 following and the approximate curve for the decline of Dieldrin concentrations drawn in. The approx. r2 values for these curves are 0.93 and 0.95 respectively giving a high degree of correlation of the fit of the curves.
NON-LINEAN REGRESSION CURVES FOR DECLINE IN DIELDRIN CONCENTRATIONS IN BULK MILK.
Figure 6.
Property
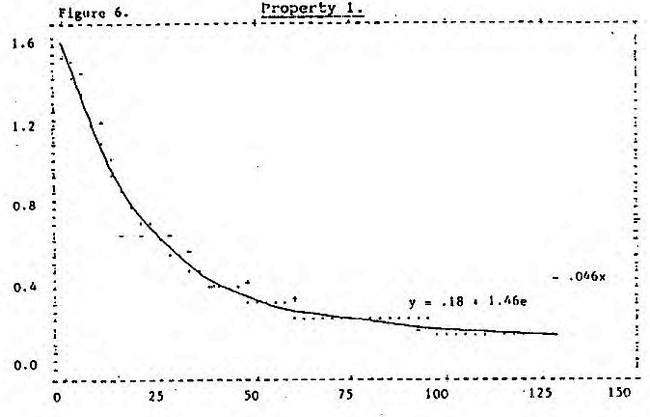
Figure 7.
Property 2.
It is considered that where we are dealing with Dieldrin concentrations in milk as in this case, the half life of Dieldrin concentrations is not applicable. The Dieldrin concentrations seen in these results, actually represents the excretion rate of Dieldrin in milk and not the decay rate of Dieldrin which is seen in a non-lactating animal.
A true half life would be that seen in the calf sampled where body fat concentrations of Dieldrin fell from 0.36 to 0.19 mg/kg Dieldrin in 89 days. If one tries to apply half lives to the bulk milk results we find there is a big variation in these values depending on what stage we look at. In the early stages the half life would be considered to be approx. 12 days. The next half life would be approx. 35 days followed by 53 days in the latter stages. These values appear to be of little value in predicting what will happen in the field.
One of the prime concerns in dealing with pesticide residues in livestock is to be able to give some predictions as to the rate of fall of the residue concerned and the time it will take to reach the MRL for the pesticide concerned.
In this case where we are dealing with Dieldrin residues in milk, the time taken to reach the MRL is largely determined by the concentration reached after the initial drop as the rate of decline after about 14 days appears to be reasonably constant. If the Dieldrin concentrations are assessed after the initial drop i.e. 10-20 days, the rates of decline we have established could then be used to calculate the approximate number of days it will take the concentration of Dieldrin to fall to the MRL.